 Blind depth quality metric (BDQM)
M.S. Farid, M. Lucenteforte, M. Grangetto, "Blind Depth Quality Assessment using Histogram Shape Analysis," Proc. 3DTV-Conference: The True Vision - Capture, Transmission and Display of 3D Video (3DTV-CON), Lisbon, 2015, pp. 1-5.
Abstract: Multiview videos plus depth (MVD) is a popular 3D video representation where pixel depth information is exploited to generate additional views to provide 3D experience. Quality assessment of MVD data is of paramount importance since the latest research results show that existing 2D quality metrics are not suitable for MVD. This paper focuses on depth quality assessment and presents a novel algorithm to estimate the distortion in depth videos induced by compression. The proposed algorithm is no-reference and does not require any prior training or modeling.
The proposed method is based solely on the statistical analysis of the compression sensitive pixels of depth images. The experimental results worked out on a standard MVD dataset show that the proposed algorithm exhibits a very high correlation with conventional full-reference metrics.
Download
- Matlab Implementation of BDQM
- Function used for Nonlinear Regression in experimental evaluation of BDQM
If you use the above code in your research, we kindly ask that you cite the following paper:
- M.S. Farid, M. Lucenteforte, M. Grangetto, "Blind Depth Quality Assessment using Histogram Shape Analysis," Proc. 3DTV-Conference: The True Vision - Capture, Transmission and Display of 3D Video (3DTV-CON), Lisbon, 2015, pp. 1-5
Objective Evaluation:
Statistical evaluation of BDQM. The following figure shows the scatter plot of BDQM versus PSNR (after nonlinear mapping) along with the values of statistical performance parameters.
Test Sequence: Poznan Hall2
|
Test Sequence: Poznan Street
|
||||||||||||
Test Sequence: Kendo
|
Test Sequence: Balloons
|
||||||||||||
Test Sequence: Book Arrival
|
Overall |
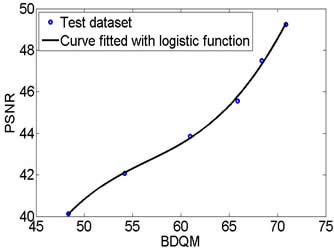
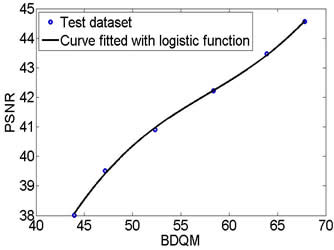
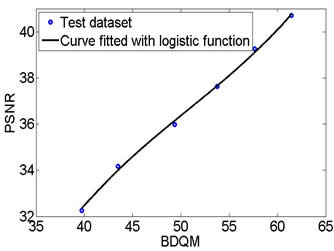
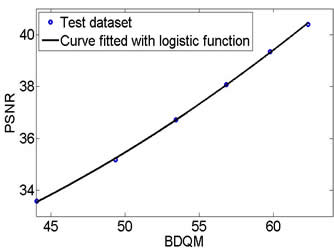
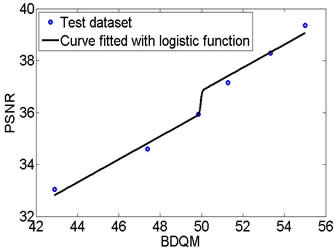
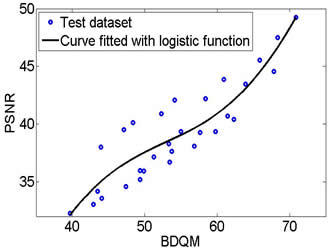
Table 1. Performance parameters: Pearson Linear Correlation Coefficient (PLCC), Spearman rank order correlation coefficient (SROCC) and Kendall rank order correlation coefficient (KROCC), Root Mean Square Error (RMSE) and Mean Absolute Error (MAE) measures over all sequences.
| PLCC | SROCC | KROCC | RMSE | MAE |
| 0.9076 | 0.8439 | 0.7089 | 1.7498 | 1.4902 |
Visual Evaluation:
The following figure presents the first depth image of Kendo depth sequence encoded at different QP values with HEVC for a visual comparison of BDQM scores with respective depth images and corresponding PSNR values. A high correlation can be observed between the visual quality of the depth image and the corresponding predicted scores. It shows the reliability of the proposed metric to predict the quality of depth maps without using a reference image or a trained model.
QP=26: PSNR=44.08, BDQM=58.49 |
QP=30: PSNR=43.11, BDQM=53.26 |
QP=34: PSNR=41.84, BDQM=50.56 |
QP=38: PSNR=40.25, BDQM=46.46 |
QP=42: PSNR=38.44, BDQM=38.12 |
QP=46: PSNR=36.25, BDQM=34.96 |


Last updated: May 27, 2015