 Synthesized Image Quality Evaluator (SIQE)
M.S. Farid, M. Lucenteforte, M. Grangetto, "Objective Quality Metric for 3D Virtual Views,"
to appear in ICIP 2015.
Abstract: In free-viewpoint television (FTV) framework, due to hardware and bandwidth constraints, only a limited number of viewpoints are generally captured, coded and transmitted; therefore, a large number of views needs to be synthesized at the receiver to grant a really immersive 3D experience. It is thus evident that the estimation of the quality of the synthesized views is of paramount importance. Moreover, quality assessment of the synthesized view is very challenging since the corresponding original views are generally not available either on the encoder (not captured) or the decoder side (not transmitted). To tackle the mentioned issues, this paper presents an algorithm to estimate the quality of the synthesized images in the absence of corresponding reference images. The algorithm is based upon the cyclopean eye theory. The statistical characteristics of an estimated cyclopean image are compared with the synthesized image to measure its quality. The prediction accuracy and reliability of the proposed technique are tested on standard video dataset compressed with HEVC showing excellent correlation results with respect to state-of-the-art full reference image and video quality metrics.
Download
- Matlab Implementation of SIQE
- Function used for Nonlinear Regression in experimental evaluation of SIQE
If you use the above code in your research, we kindly ask that you reference the following paper:
- M.S. Farid, M. Lucenteforte, M. Grangetto, "Objective Quality Metric for 3D Virtual Views," to appear in IEEE International Conference on Image Processing (ICIP), 2015.
Experimental Evaluation:
Table 1. Pearson Linear Correlation Coefficient (PLCC)
| Sequence | VQM | FSIM | SSIM | MSSIM | iwSSIM | PSNR | UQI |
| Poznan Hall2 | 0.9211 | 0.8894 | 0.9098 | 0.8884 | 0.8848 | 0.6489 | 0.9725 |
| Poznan Street | 0.9457 | 0.8621 | 0.9165 | 0.9201 | 0.9038 | 0.8623 | 0.9937 |
| Book Arrival | 0.8941 | 0.8531 | 0.8707 | 0.8547 | 0.8463 | 0.8694 | 0.9679 |
| Balloons | 0.8485 | 0.8923 | 0.8974 | 0.9002 | 0.8884 | 0.7781 | 0.8799 |
| Avg: | 0.9024 | 0.8742 | 0.8986 | 0.8909 | 0.8808 | 0.7897 | 0.9535 |
Table 2. Root Mean Square Error (RMSE)
| Sequence | VQM | FSIM | SSIM | MSSIM | iwSSIM | PSNR | UQI |
| Poznan Hall2 | 0.0412 | 0.0059 | 0.005 | 0.0045 | 0.0135 | 0.5834 | 0.0099 |
| Poznan Street | 0.0506 | 0.0071 | 0.0094 | 0.0086 | 0.0158 | 0.6546 | 0.0122 |
| Book Arrival | 0.0597 | 0.0089 | 0.0108 | 0.0093 | 0.0177 | 0.726 | 0.0164 |
| Balloons | 0.0653 | 0.0078 | 0.0094 | 0.0071 | 0.0153 | 0.6819 | 0.0275 |
| Avg: | 0.0542 | 0.0074 | 0.0087 | 0.0074 | 0.0156 | 0.6615 | 0.0165 |
Visual Evaluation:
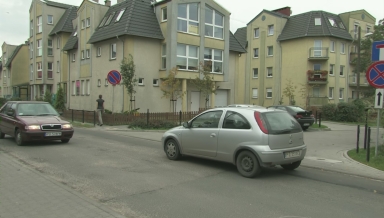
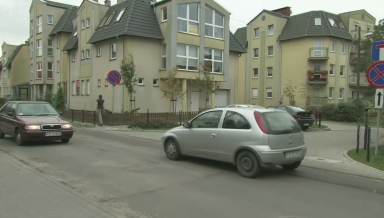
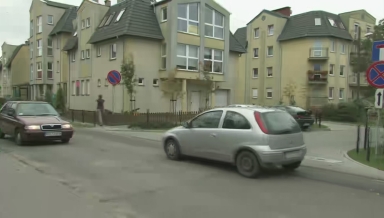
The following figure shows the 10th synthesized picture of Poznan_Street video sequence obtained from texture and depth videos encoded with HEVC at QP 26, 34, 38, and 46 respectively. The captions show the quality score given by VQM, FSIM, SSIM, MS-SSIM, iwSSIM, and PSNR and the estimated SIQE values for each image.
This allows one to note that how accurately the visual quality of the DIBR synthesized image is predicted by the proposed quality metric.
QP = 26
|
QP = 34
|
||||||||||||||||||||||||||||
QP = 38
|
QP = 46
|

Last updated: May 5, 2015